ETH Bulls Look to Push Above $4K, but is the Rally Sustainable? (Ethereum Price Analysis)

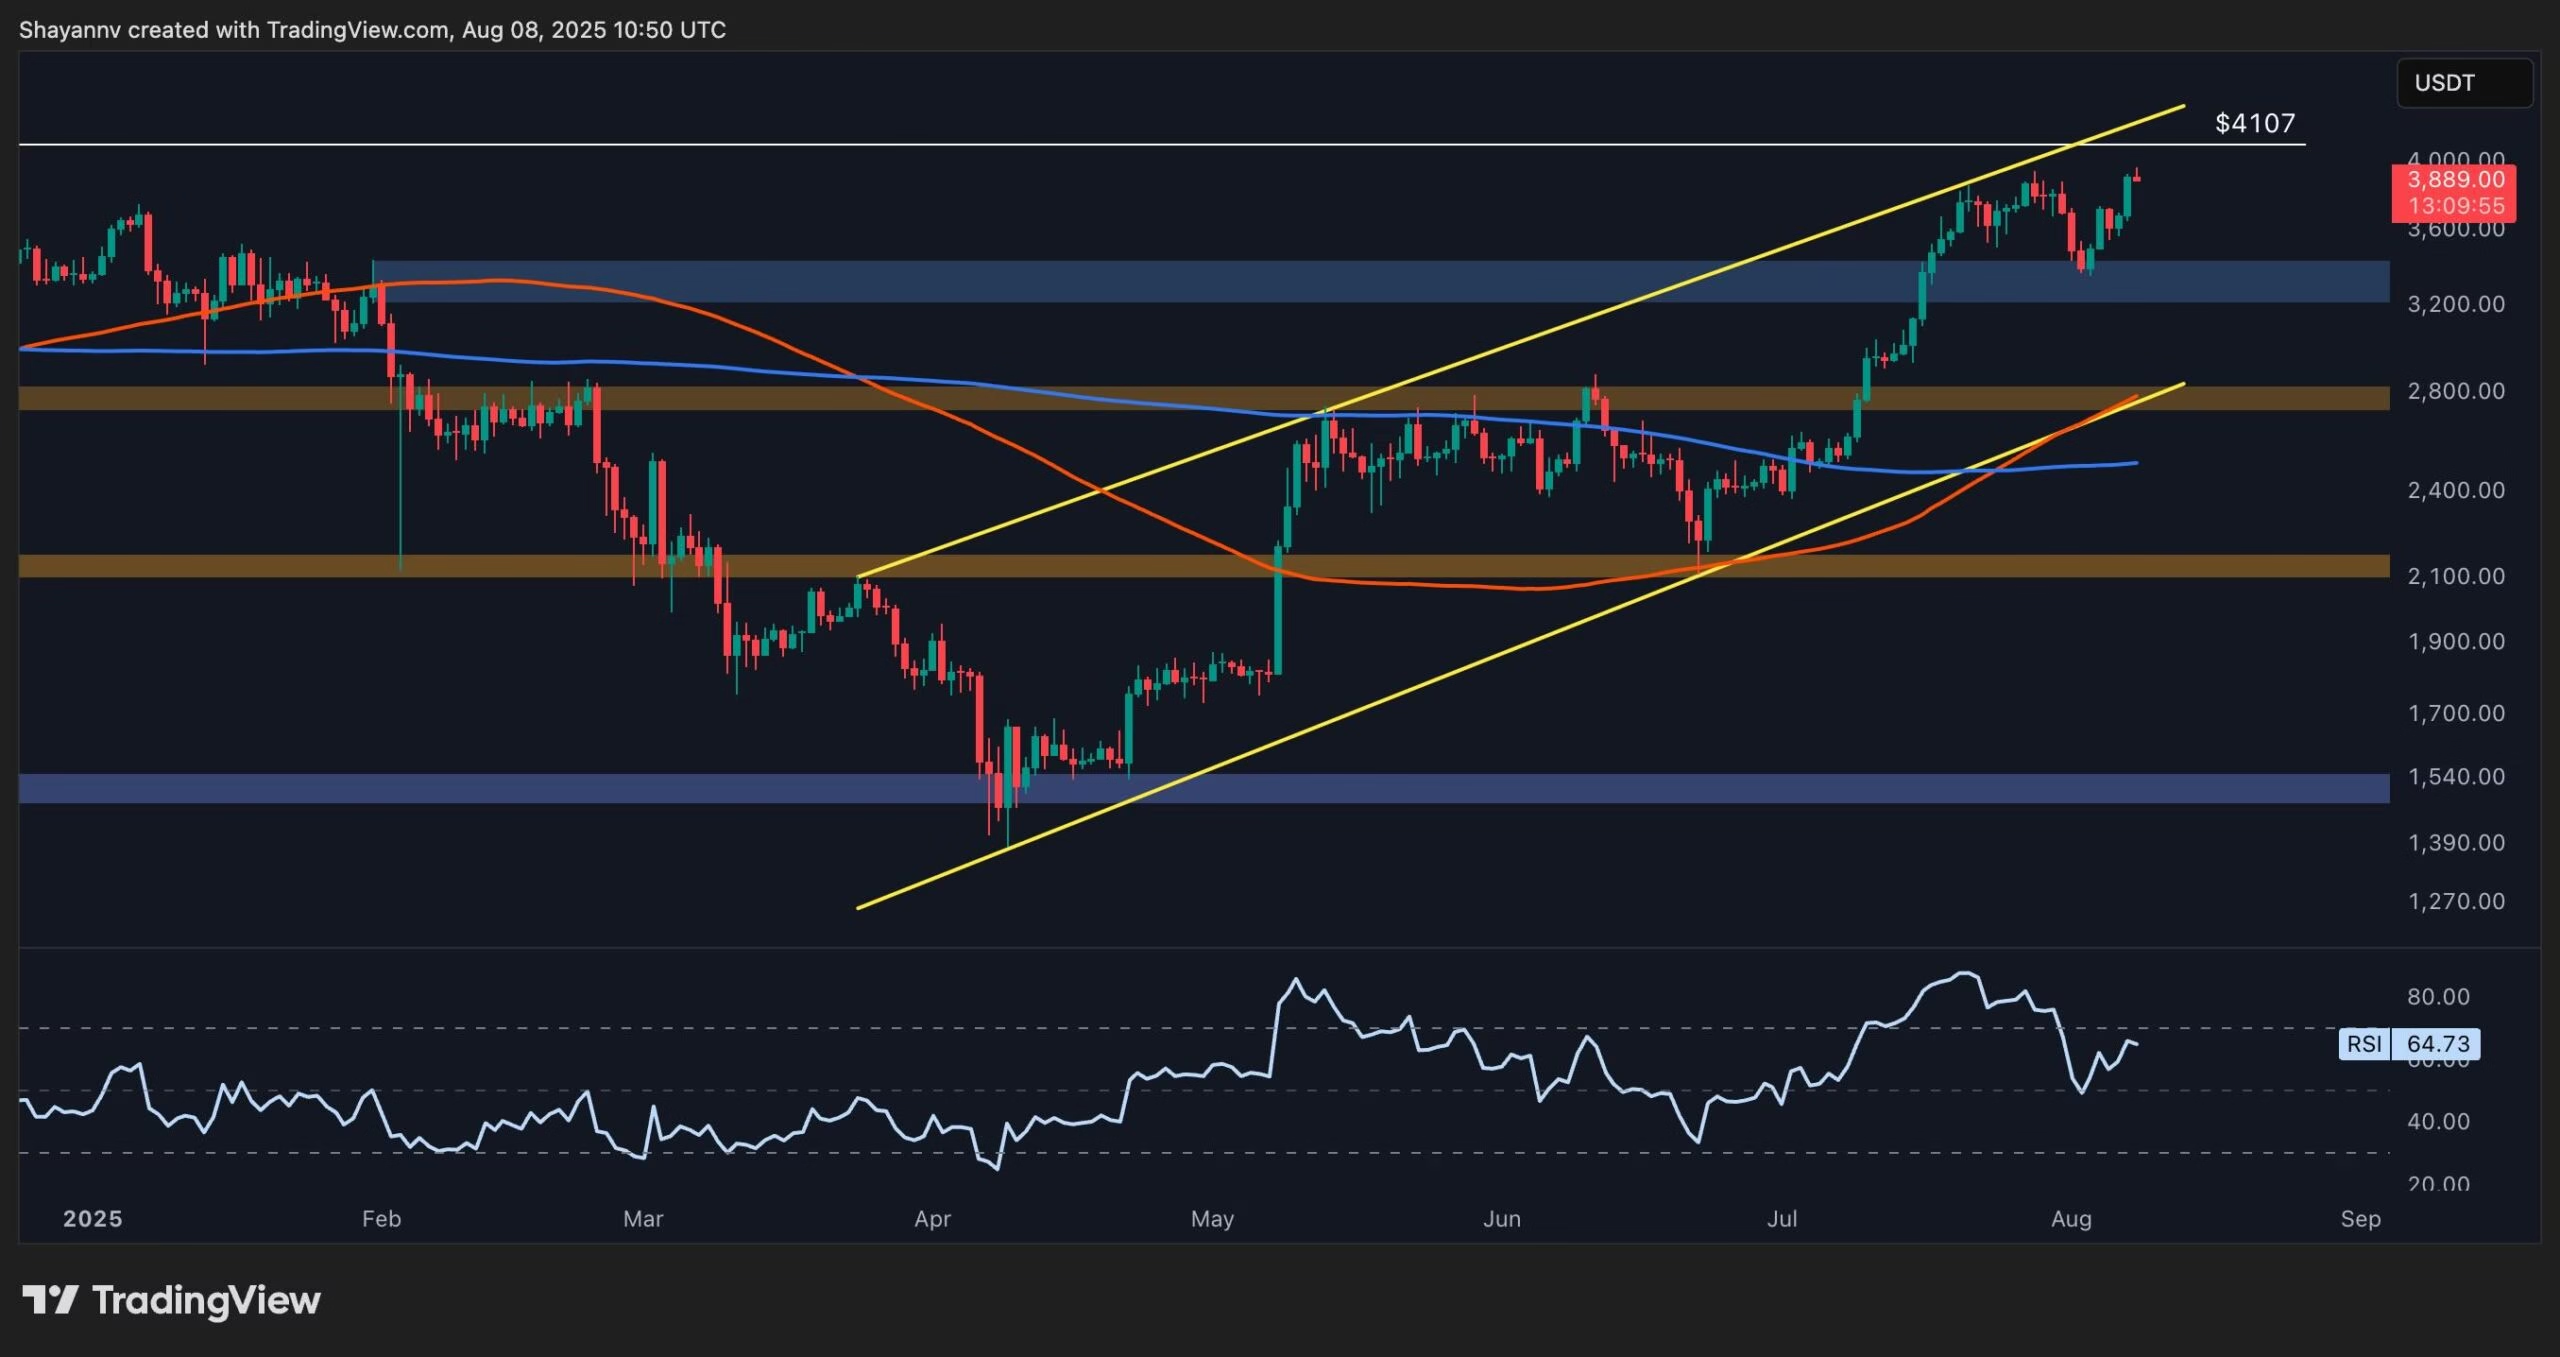
Ethereum’s price has been making higher highs and lows for a while now, climbing toward the key $4,000 mark. While both technical methods and sentiment metrics point to more upside, caution is advised, as the market might be in for a pullback soon. Ethereum Price Analysis: Technicals By Shayan The Daily Chart The daily chart demonstrates ETH’s upward path inside a large ascending channel. This uptrend began in the middle of April, and the price has broken multiple resistance levels to the upside. Both the 100-day and 200-day moving averages are also located below the price now, with the 100-day MA having an upward slope following a bullish crossover earlier. As things stand, the market is very likely to push beyond the high of $4,107 and even toward a new all-time high in the coming months, if the channel is broken to the upside. On the other hand, however, a rejection from the higher trendline of the channel could push the price back toward the $3,200 area, which would be the deciding point for whether a short-term correction or a full-on reversal is on the table. Source: TradingView The 4-Hour Chart The 4-hour chart shows an interesting reaccumulation phase going on, which mostly occurs after a rally. The price has been consolidating between the $3,500 and $3,800 levels, with a fake breakout and liquidity sweep occurring below the $3,500 zone. Currently, the price is on the verge of breaking above the $3,900 high, and in case of an impulsive follow-up, the market would likely begin a new aggressive rally as ETH hunts for a new all-time high. The RSI is also around 67, confirming bullish momentum, but also hinting at a potential overbought condition occurring soon. Yet, it will not mean that the market will reverse lower, at least not before a bearish divergence occurs. Source: TradingView Sentiment Analysis Coinbase Premium Index The Coinbase Premium Index is a metric that measures the difference between Bitcoin’s price on Coinbase and that of Binance. As the chart shows, the index has been mostly printing positive values since the beginning of the current rally in April. This indicates that there is considerable demand from American Investors, compared to other countries. Looking to the past, the Coinbase Premium Index demonstrates a positive correlation with price action, as positive values have led to price rallies more often than not. Therefore, as the current situation suggests, the probability of further bullish price movement is higher than a reversal, and market sentiment supports the upward price action seen on technical charts. Source: TradingView   The post ETH Bulls Look to Push Above $4K, but is the Rally Sustainable? (Ethereum Price Analysis) appeared first on CryptoPotato. Powered by WPeMatico

Bitcoin Price Analysis: is BTC About to Hit $120K or $110K Next?

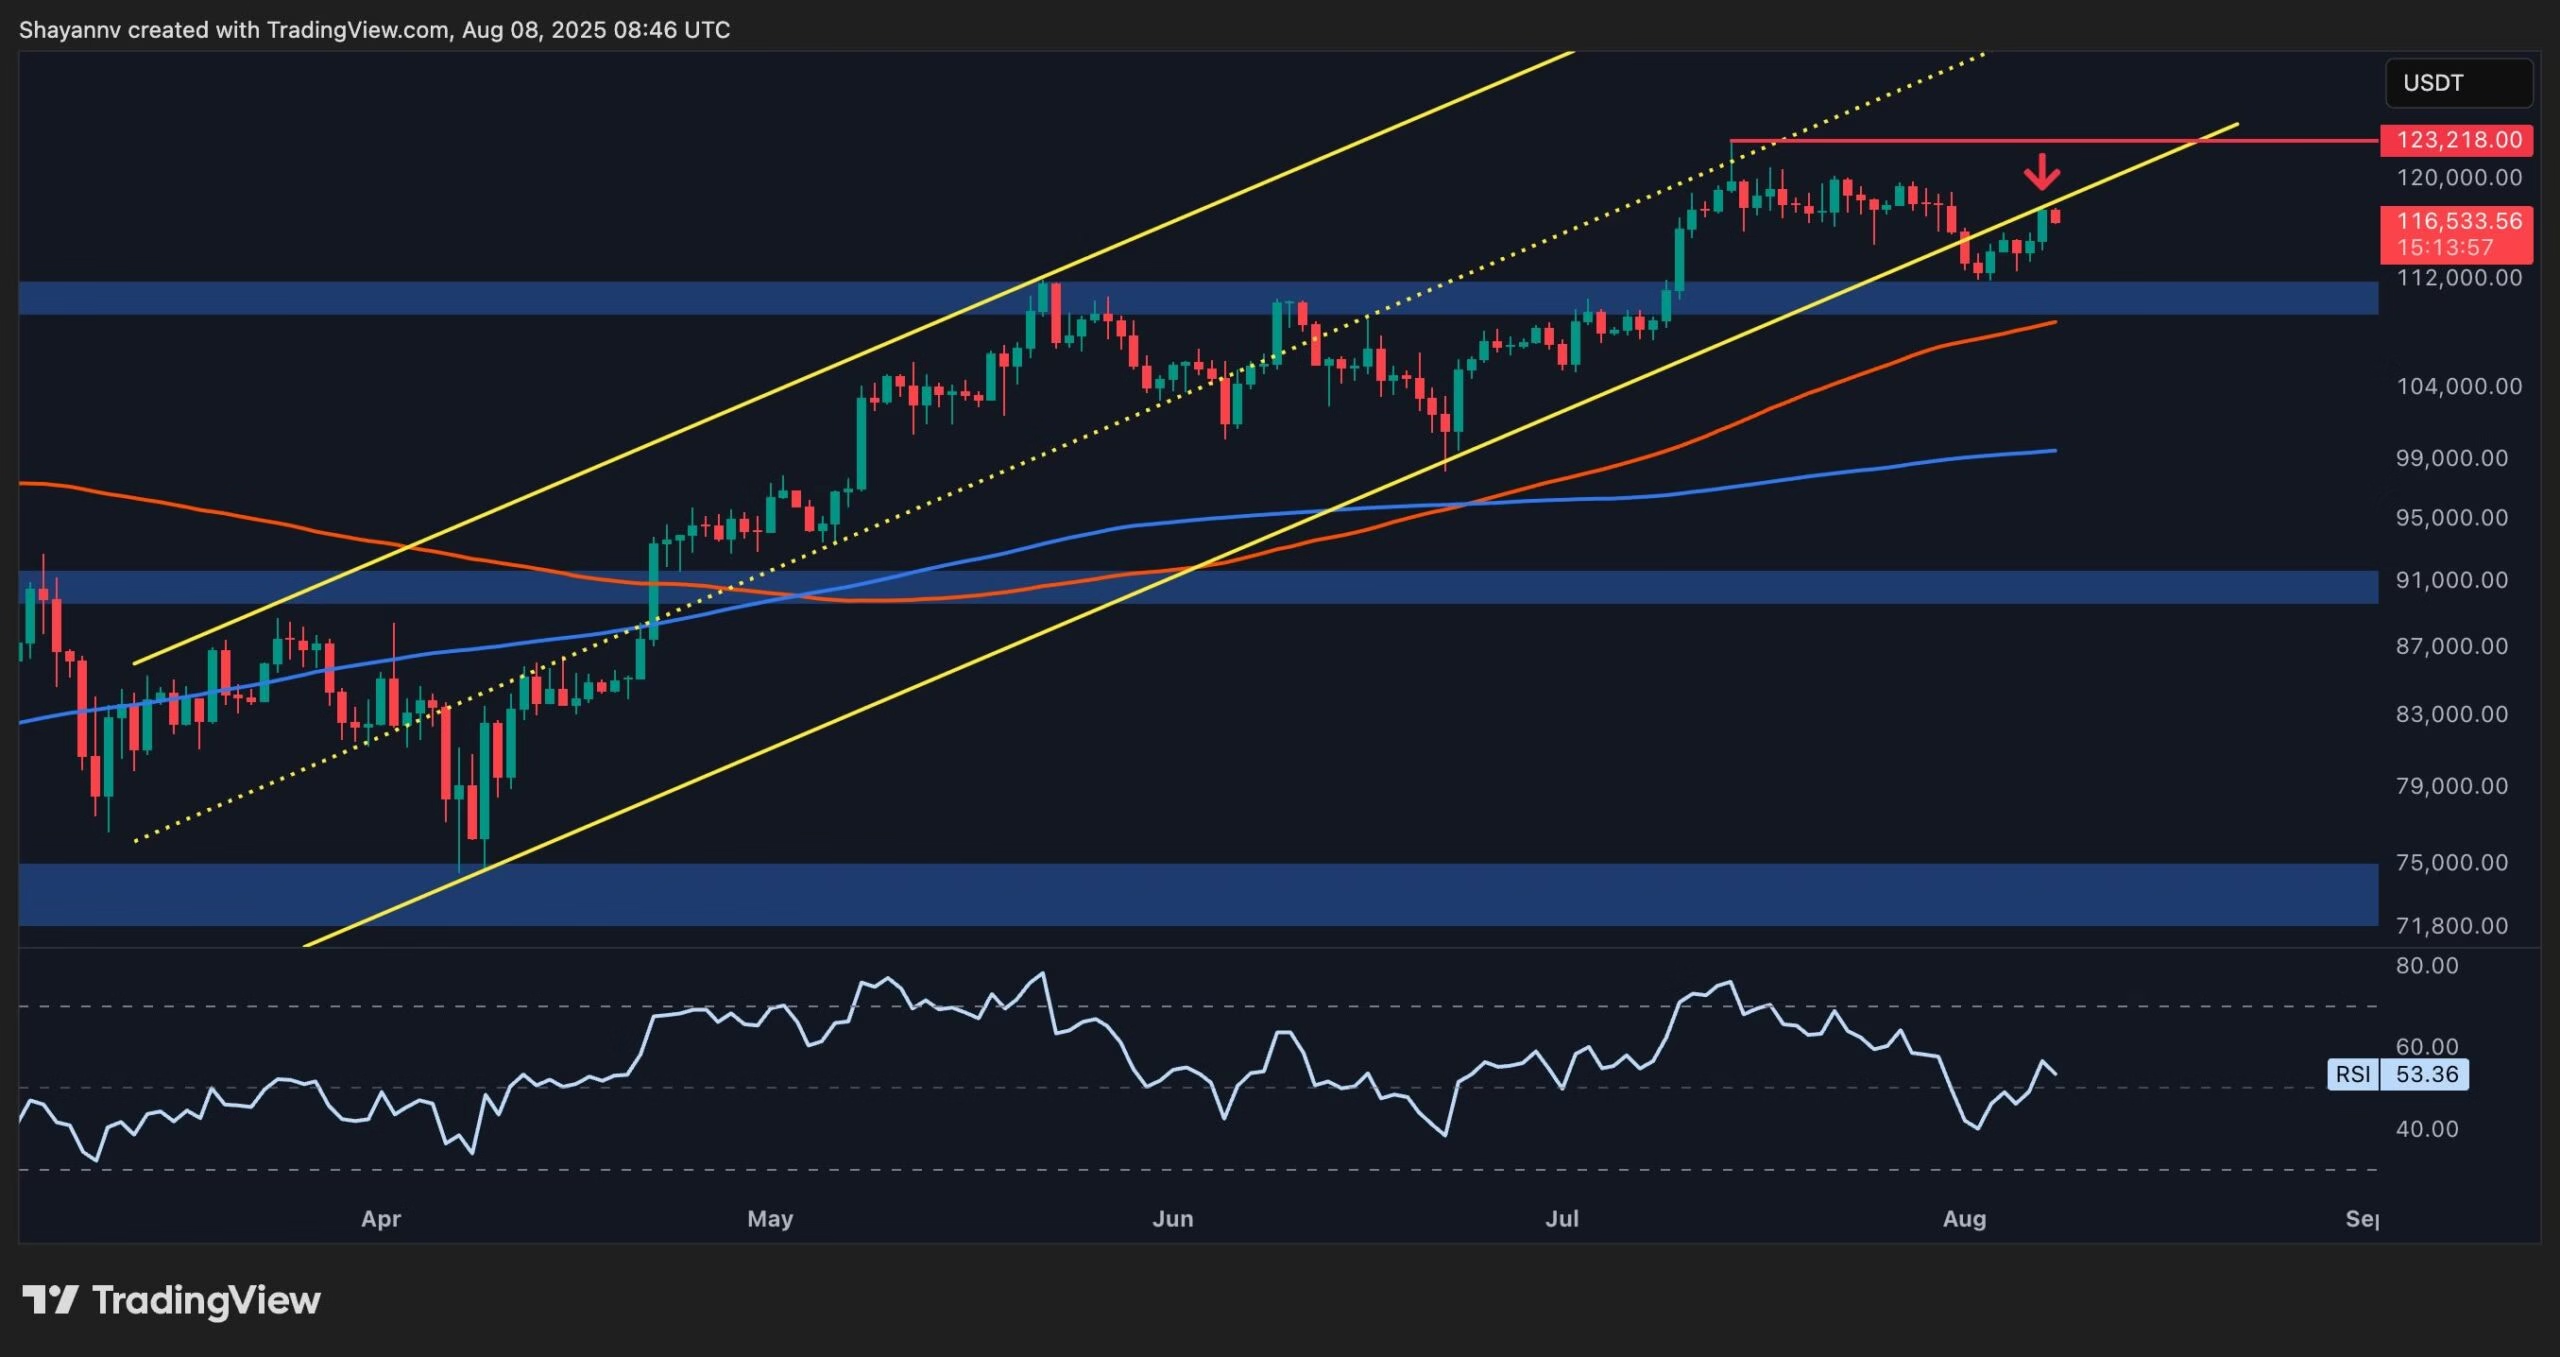
Bitcoin continues to consolidate above the $116K level as bulls attempt to defend critical support following a pullback from the $123K all-time high. While the broader uptrend remains intact, recent price action reflects uncertainty and tightening range dynamics. With macroeconomic tensions rising and risk sentiment mixed, BTC’s next major move could be triggered by key technical levels. Technical Analysis By Shayan The Daily Chart Bitcoin’s daily structure shows a breakdown and pullback to the ascending channel that’s been respected for months. After the drop from $123K, and the midline of the channel, BTC has finally broken the channel to the downside and is consolidating below it. This is a concerning development, as it might lead to deeper corrections. The price is currently attempting to hold above the 100-day moving average, which is located near the $110K support level. The RSI also sits around 51, signaling a neutral momentum state. Yet, if a bearish shift occurs following a rejection from the channel’s lower boundary, and the $110K level breaks down, the next high-confluence zone lies around the psychological $100K level. This zone also aligns with the key 200-day moving average. Source: TradingView The 4-Hour Chart The 4-hour chart shows BTC declining inside a descending channel since the price dropped from the $123K level. The cryptocurrency is now trying to break the channel to the upside, as it broke through the $116K short-term resistance. The price is rebounding from the 50% area of the Fibonacci retracement tool, which also adds to the probability of a bullish continuation to begin from this zone. Moreover, the RSI is showing a bullish shift in momentum as it has risen above the 50% level. As a result, if the price holds above the $116K level, it will likely break out of the descending channel and rally toward the $123K all-time high and beyond in the coming weeks. Source: TradingView Onchain Analysis Exchange Whale Ratio The Exchange Whale Ratio is flashing a warning signal. It has been steadily climbing and is now at its highest level since early 2023. Historically, such spikes, especially above 0.5, tend to precede either distribution events or significant profit-taking, as large holders increasingly dominate inflows to exchanges. This rise, combined with the stalled momentum in price, suggests whales may be preparing to offload into strength. While it doesn’t guarantee a reversal, it typically marks local tops or slower price progress until new demand kicks in. Traders should watch closely for on-chain outflows and derivatives positioning to see if the current uptick in whale activity turns into real selling pressure. Source: CryptoQuant The post Bitcoin Price Analysis: is BTC About to Hit $120K or $110K Next? appeared first on CryptoPotato. Powered by WPeMatico

Ripple (XRP) Price Predictions: $4 in Sight After Ripple’s SEC Victory?

TL;DR XRP gains 9% daily after Ripple settles with SEC, boosting confidence across crypto markets. Whale wallets show mixed signs; exchange reserves fall while large transfers remain unusually high. XRP holds above $3.20 support with bullish momentum; RSI nears overbought, but trend still intact. The following presents multiple Ripple (XRP) price predictions given the above context. Ripple (XRP) Price Predictions: The Context  In the last 24 hours, XRP has posted a sharp move higher. At the time of writing, the token trades around $3.31, representing a 9% daily gain. The price increase places XRP just below its yearly high of $3.65, a level touched three weeks earlier. For the week, XRP is now up more than 13%. During this period, the price has fluctuated between $2.77 and $3.36, while the past day saw a range between $3.03 and $3.37. Daily trading volume is also up, with more than $9.9 billion exchanged across major platforms. Notably, these movements come directly after Ripple finalized a legal settlement with the United States Securities and Exchange Commission. The deal ended a lengthy legal case that started in 2020. No further appeals will follow. With the case now behind the company, many traders and investors have adjusted their outlook on XRP. Market Responds to Institutional Activity Soon after the legal resolution became public, transaction monitors flagged a large XRP transfer. More than 16.6 million XRP, valued at over $55 million, moved to Coinbase from an unrecognized wallet. This transfer was one of the largest seen in recent months. Interestingly, the transaction coincided with a surge in trading volume. Price moved quickly through areas of prior resistance. XRP cleared the $3.10 to $3.15 zone with high volume.  Buying pressure has been steady, supported by higher-than-normal inflows during the early hours of trading on August 8. This price strength has been attributed to renewed interest from institutional traders. Technical Picture: Holding Support, Aiming Higher Charts suggest XRP is still within a bullish structure. The price broke out of a falling wedge pattern that had formed after a mid-July peak. The breakout occurred near $3.07, which lines up with the 0.786 Fibonacci retracement level. A quick move followed, pushing the token up to $3.35 before slight retracement. Now, the token is consolidating near $3.31. This price region is close to the 0.618 Fibonacci level, which has acted as a key zone in previous cycles. If the market holds above $3.20, there may be enough momentum to challenge $3.65 again and even push toward $4. Source: TradingView Support is currently found at $3.20 and $3.00. If the XRP price fails to hold these levels, a deeper pullback could reach the $2.72 area. This level previously saw strong demand in late July and may act as a base if needed. The Relative Strength Index (RSI) is now at 67.9. This level shows growing buying interest but is not yet in overbought territory. If RSI moves past 70, traders may expect consolidation before any continuation. Earlier, market analyst Ali Martinez pointed to a successful breakout from the 0.786 to the 1.414 Fibonacci extension. That target near $3.34 has now been met, indicating the pattern played out with precision. This may help chart future targets if volume remains steady. Source: X Whale Moves Create Mixed Sentiment  On-chain data from CryptoQuant shows that large XRP holders have been active. In the first week of August, the XRPL Whale Flow indicator turned negative. This metric tracks the difference between inflows and outflows from large wallets. A negative reading suggests more tokens are being moved out than added. Source: CryptoQuant On July 31, analysts recorded over 51,000 large transactions on the network. Four days later, the figure remained high at 38,000. Earlier this year, a similar pattern came before a price drop from $3.40 to around $1.60. That move also saw a spike in large transfers, signaling distribution among major holders. However, not all movement from whales points to selling. Data also shows that total exchange reserves have fallen. Between July 24 and August 7, XRP held on centralized exchanges dropped from 3.02 billion to 2.3 billion. When large amounts of a token are removed from exchanges, it often suggests holders are choosing to store assets rather than trade them. If this trend continues, it may lower available supply and ease some of the selling pressure. Still, this must be weighed against high-frequency activity from whale accounts, which may signal further repositioning. Transaction Activity Picks Up After XRP’s Price Surge The network value to transactions (NVT) ratio, a measure comparing market cap to on-chain volume, has recently shifted. On August 7, XRP’s NVT ratio reached 225, reflecting a sharp rise in price while transaction activity lagged behind. As of the latest data, the NVT has pulled back to 177.5, a drop of over 21%. This decline suggests that on-chain usage is starting to catch up with market valuation. The earlier spike in the ratio raised concerns that XRP might be outpacing its real-time utility. The recent drop eases some of those concerns. Source: CryptoQuant This change may signal better alignment between how much XRP is being moved and how the market is valuing it. In previous cycles, a high NVT ratio often came before price corrections. This time, however, the lower reading could mean network activity is recovering after the price jump, supporting the current range. Do XRP Price Predictions Make Sense? Price forecasts are often based on technical patterns and market conditions more generally. For XRP, the end of the SEC lawsuit removes one of the key unknowns that had weighed on its valuation. Short term price predictions may be beneficial, but they are very susceptible to the day-to-day market fluctuations, news activities, and trading patterns. XRP’s market remains highly reactive to both external developments and on-chain behavior. Several aspects such as liquidity, macro market trends, and investor sentiment should be always termed in predictions. How Are Ripple Price Predictions Made? Forecasts for XRP come from a mix of technical, fundamental, and on-chain
This XRP Signal Consistently Foreshadows Price Jumps: Analytics Firm

On-chain analytics firm Santiment has pointed out how utility spikes on the XRP network tend to precede bullish price action in the asset’s price. XRP Network Activity Lit Up Before The Latest Price Surge In a new post on X, Santiment has discussed about some network activity-related indicators for XRP. The metrics in question are the Transaction Volume and Circulation. The first of these, the Transaction Volume, measures the total amount of the cryptocurrency that’s becoming involved in transfers on the blockchain every day. While this metric does provide a sense of overall activity occurring on the network, it may give a skewed picture of investor behavior. This is because of the fact that not all transfers being made on the chain represent true economic activity. Many of them involve the same part of the supply, constantly in motion due to repeat trades or internal shuffling. The second indicator, the Circulation, helps filter for these moves like these. This metric keeps track of the daily unique number of tokens being shifted on the XRP network. By ‘unique,’ what’s meant here is that no matter how many times a particular coin becomes involved in transfer activity on the blockchain, it still contributes just one unit toward the indicator’s value. Now, here is the chart shared by Santiment that shows the trends in both of these XRP metrics over the last few months: As displayed in the above graph, the XRP Transaction Volume saw a huge spike to $2.1 billion on August 1st. This 6-month high surge in the metric came as the asset’s price was going through a drawdown toward a low near $2.70. Alongside the rise in volume, the Circulation also registered a spike to 1.12 billion tokens, indicating that the transfer activity occurring on the network was organic. Since this burst of activity on the blockchain, the cryptocurrency has witnessed some recovery. From the chart, it’s visible that there have also been spikes in these indicators in the past that led into a price surge for the coin. “Utility spikes on the network consistently foreshadow price jumps,” notes the analytics firm. In some other news, XRP broke out of a triangular channel on Thursday, as analyst Ali Martinez explained in an X post. Generally, breakouts above a triangle’s upper level are considered to be bullish signals in technical analysis (TA). And indeed, as the pattern may have foreshadowed, the asset has ended up enjoying a surge since then. XRP Price At the time of writing, XRP is floating around $3.29, up more than 7% over the last 24 hours. Powered by WPeMatico

Bitcoin Bull Run At Risk? Binance Whale-To-Exchange Flow Signals Price Correction

After failing to decisively break above the $120,000 level in mid-July, Bitcoin (BTC) could face further price corrections as whales continue to increase BTC inflows to the Binance crypto exchange. Is Bitcoin Losing Its Bullish Momentum? According to a recent CryptoQuant Quicktake post by contributor Arab Chain, fresh data from the Binance Whale-to-Exchange Flow indicator suggests that BTC may soon experience additional downside pressure. The analyst noted that despite growing retail participation in the BTC market, persistently high whale inflows into Binance – combined with a declining Bitcoin price – signal that the market could be entering a technical correction phase. Arab Chain shared the following chart, where the purple zone shows that whale inflows to Binance remained consistently high throughout July and early August. At the same time, the drop in BTC price reflects a distribution pattern, where whales begin unloading BTC on exchanges following a sharp rally. Although there were no extreme spikes, whale inflows into Binance stayed elevated in the $4 billion to $5 billion range, indicating that these large holders are actively moving BTC onto the exchange – often a precursor to major sell-offs. The fact that these inflows remain high on Binance despite the drop in BTC price suggests that either whales are still selling their holdings on the exchange, or they are waiting for a price rebound to exit the market. Similarly, the light blue area in the chart shows a notable increase in retail inflows to Binance during late July and early August. Historically, such late-stage retail participation often marks the final phase of a bullish cycle, providing exit liquidity for whales. The analyst concluded: Despite the rise in retail participation, the market shows signs of internal weakness, with sustained whale inflows to Binance and loss of upward momentum. If this behavior continues, the market may be entering a medium-term correction phase. Investors Still Optimistic About BTC While signals suggest the current BTC rally may be overextended, some investors remain confident, employing strategies like Smart Dollar-Cost Averaging (DCA) to accumulate BTC in anticipation of further price gains. Fellow CryptoQuant analyst Oinonen noted that while the recent pullback in BTC price may have raised concerns about further declines, the asset’s historical Q4 performance could propel it to a new all-time high of $200,000 by the end of 2025. After hitting a recent low around $111,800, BTC has recovered part of its losses and is now trading near $116,500. Still, some analysts caution investors against “excessive optimism.” At press time, BTC was trading at $116,501, up 0.2% over the past 24 hours. Powered by WPeMatico

Analyst Outlines How Production Cost Determines XRP Price, But Is It Better Than Bitcoin?

A fresh debate in the crypto space has emerged over whether the cost of production significantly impacts the XRP price and the value of Bitcoin (BTC). Market expert CrediBULL Crypto has outlined how these costs influence XRP’s value compared to Bitcoin, concluding that both cryptocurrencies follow the same pricing formula.  XRP Price Formula Mirrors That Of Bitcoin A recent discourse on X social media has reignited discussions on whether production costs play a decisive role in determining the prices of cryptocurrencies. CrediBULL Crypto weighed in, explaining that both Bitcoin and XRP follow the same fundamental pricing model, where the cost to produce, combined with speculative and utility value, determines the market price.  For Bitcoin, the analyst notes that the cost to mine, taking into account energy consumption and time, represents a significant portion of BTC’s market price. This production cost forms the “X” variable in the analyst’s pricing equation, with the remainder driven by speculative demand and utility.  In contrast, CrediBULL Crypto highlights that XRP’s production cost is negligible, arguably near zero, meaning its market price is primarily driven by demand, adoption, and other speculative factors. Whether mined or premined, the analyst asserts that the market ultimately assigns a value above the production cost based on perceived utility and shifts in investor sentiment.  CrediBULL Crypto’s statement comes in response to a recent clash between market expert BD and Robert Breedlove, a Bitcoin maximalist. In his post, Breedlove suggested that XRP’s “100% premined” status set it apart from Bitcoin, which he asserts is a 0% premined coin. The Bitcoin maximalist also warned investors of the potential consequences of this difference, subtly implying that XRP could be a scam token.  BD countered, asserting that market demand, not production method, dictates price. He further emphasized that neither mining costs nor premined supply inherently determines a cryptocurrency’s long-term value.  Demand Dictates Long-Term Survival  Following CrediBULL Crypto’s statement, a community member argued that premined assets, like XRP, could carry higher risks, such as large-scale sell-offs or “rug pulls,” potentially driving their value to zero. They further suggested that BTC’s mined supply structure offers more protection against such scenarios.  CrediBULL Crypto, however, pushed back, stating that production costs do not guarantee long-term survival or resilience. He noted that demand can disappear for any asset, regardless of whether it costs $5 or $100 to produce. He added that the same principle also applies to Bitcoin and XRP, which are respectively priced at $116,601 and $3.34, at the time of writing.  The analyst further pointed out that just because a commodity costs money to produce does not make it inherently valuable. Without sustained interest, even a high-cost-to-produce asset could collapse in value. To illustrate this point, the analyst compared it to investing substantial resources into digging a massive hole—a process requiring real effort but might hold no value if no one finds the hole useful. Powered by WPeMatico

SharpLink Bets Big On Ethereum: $200M Raised To Deepen ETH Exposure

SharpLink Gaming has announced a $200 million capital raise aimed at expanding its Ethereum treasury. As ETH solidifies its role as programmable money and a yield-bearing asset through staking, SharpLink is betting big on its long-term potential. The raise positions the company among a rising class of corporates reshaping capital strategy around blockchain-native assets. Why SharpLink Is Going All-In On Ethereum In an X post, SharpLink Gaming shared an update stating that the company has secured $200 million capital raise through a direct offering priced at $19.50 per share, and has been backed by four global institutional investors. According to the company, the capital will be strategically deployed to expand its ETH treasury holdings. Upon full deployment, SharpLink expects its ETH reserves to exceed $2 billion, placing it among the most ETH-heavy corporate treasuries globally. The company focuses on accumulating ETH, staking ETH to earn sustainable on-chain yield, and consistently growing ETH-per-share for long-term shareholders. Ethereum is becoming the foundational layer of global finance infrastructure for tokenized assets, and SharpLink is built to capture that upside. According to the DuRtY_Crypto post, Vitalik Buterin recently pointed out that ETH treasuries are increasingly valuable, not just as a store of ETH, but as a different vehicle for people to have access to ETH. Instead of simply buying ETH and holding it, investors are turning to companies that hold and manage ETH treasuries. DuRtY_Crypto has outlined the irony that was unseen between the Bankless crew, who quickly celebrated the mainstream validation. The PulseChain Sacrifice Wallet has skyrocketed to become the 5th-largest ETH holder in crypto with 171,054 ETH. Before the funds rotated into ETH, the wallet was already commanding attention as the largest DAI holder across all chains. Thus, the expert has commended Richard Heart, the controversial figure behind PulseChain, for executing a strategic pivot that few saw coming.  Ethereum Activity Heats Up As Transaction Volume Nears ATH While prominent figures are raising capital and increasing the ETH treasury’s value, CoinW has also revealed that Ethereum on-chain momentum is surging again. According to data from Etherscan, the network processed 1.87 million transactions on Aug 6th, nearing its all-time high of 1.96 million, which was set back in January 2024. Meanwhile, the validator queue data shows the ETH pOs exit queue has dropped significantly to 443,164 ETH, worth roughly $1.612 billion. Following the decline, the average exit wait time now sits at 7 days and 17 hours. With UK regulators officially lifting the ban on crypto exchange-traded notes (cETNs) for retail investors, as reported by CoinW, Ethereum’s performance may experience notable growth. This move signals a major policy shift toward embracing digital asset markets. Furthermore, it will allow individuals to engage in these risk-bearing financial products at their discretion, a move seen as aligning the UK more closely with the global crypto market. Powered by WPeMatico

Dogecoin Targets $1.60 As Historic Fractal Repeats: Analyst

A fresh chart shared on X by the pseudonymous technician Charting Guy is stoking renewed bullish chatter around Dogecoin, suggesting that the meme-coin best known for its social-media cult could be setting up for a run toward the upper boundary of a multiyear rising wedge near $1.60. Will Dogecoin Skyrocket Above $1? The analyst’s daily chart (BINANCE: DOGEUSDT) frames nearly two years of price action inside a broad, magenta-coloured ascending wedge whose support has risen from roughly $0.06 in late-2023 to $0.17 today, and whose resistance projects to $1.10–1.60 over the coming months. At press time DOGE is changing hands at $0.2219, up 8.7 percent on the day, having just pierced the wedge’s internal trend line that capped every rally until mid-July 2025. A cluster of Fibonacci retracement and extension levels anchored to the chart’s swing low at $0.0491 and swing high at $0.7605 defines the roadmap that traders are watching. The token has already reclaimed the 0.382 retracement at $0.1399 and the psychological $0.20 handle, and is now hovering above the 0.50 zone at $0.1933 – ahead of the more technically significant golden ratio at 0.618 ($0.2671). Above that, fib-derived hurdles stack at 0.702 ($0.3362), 0.786 ($0.4232), and 0.888 ($0.5596), with the full retrace level at $0.7605 and the 1.272 extension demarcated at $1.6017 – precisely where the wedge’s ceiling converges in the analyst’s projection. What lends the setup its narrative force is a cyan overlay on the same chart – a fractal copy of DOGE’s eruptive late 2024 leg – that has been transplanted onto the current structure. In that earlier episode the coin rocketed 439 percent once price tagged rising-wedge support, sliced through the internal down-sloping resistance, retested it as support and accelerated straight to the upper boundary. The overlay implies that a similar sequence has begun to unfold: DOGE revisited wedge support in late June, broke the internal trend line in mid-July, and retested it successfully this week– if the fractal continues to rhyme – could embark on a vertiginous sprint that terminates where the 1.272 extension meets the wedge roof just north of $1.60. The monthly view reinforces the bullish undertone. Charting Guy points out that the Relative Strength Index (RSI) is on the verge of a bullish cross of its own moving average in the 50–55 band. The last time that crossover occurred, in early 2024, price embarked on the aforementioned 439 percent advance. While momentum has cooled since that high, the oscillator never broke down into oversold territory, suggesting, in classical technical parlance, that DOGE has been basing rather than topping. Sceptics will note that the same wedge has twice rejected advances below $0.50, and that the memecoin still lives below every major high-time-frame supply shelf until $0.76. Yet the chart’s geometry leaves room for a rapid repricing should buyers clear the $0.27–0.34 resistance cluster: the “empty air” between the 0.702 and 0.888 fibs coincides with the steepest part of the wedge. For now, traders have a textbook trigger to watch – the internal magenta down-trend that DOGE has just tested from above. A decisive weekly close above that line, coupled with rising volume, would formally confirm the breakout scenario. Failure to hold $0.20 would invalidate the fractal and shift focus back to wedge support, currently near $0.17. Whether history will repeat with the precision that the fractal projects remains to be seen, but the structural logic on the chart is clear: so long as Dogecoin respects its four-year rising base, the path of least resistance continues to tilt higher – and the upper edge of that structure terminates at $1.60. The coming weeks should reveal whether the meme-asset can turn that technical aspiration into market reality. At press time, DOGE traded at $0.22. Powered by WPeMatico

Bitcoin Season Or Altcoin Season? Shiba Inu Exec Outlines What’s Happening

The debate over whether the crypto market is in Bitcoin Season or on the verge of Altcoin Season has dragged on for many months, especially due to Ethereum’s price action in the past few days. LUCIE, Shiba Inu’s marketing lead, recently touched on the matter, sharing insights on what’s currently happening, what to expect for an altcoin season, and when to anticipate a breakout in the Altcoin Season Index. Altcoin Season Index Points To Bitcoin Dominance Many traders and analysts have been closely watching the Altcoin Season Index, with posts on the social media platform X and news reports increasing in anticipation of a market-wide move that could favor altcoins against Bitcoin. Although the current market still tilts toward Bitcoin, signs of change are starting to emerge, especially with Ethereum now approaching the $4,000 price level. According to the Altcoin Season Index from BlockchainCenter.net, which was also shared by Shiba Inu’s marketing lead, the index is currently standing at 39, well below the 75 threshold required to confirm altseason. Notably, the data from BlockchainCenter.net shows that the index has been hovering in this range after bouncing from lower levels earlier in the year. As shown in the chart below, despite recent momentum from Ethereum and XRP, Bitcoin is still holding a dominant position in the total market cap. At the time of writing, Bitcoin dominance is currently around 61%, above the 60% level that typically signals room for altcoins to take over. Interestingly, this is a notable reduction from Bitcoin’s 64.3% dominance from three weeks ago.  Lucie attributed this decline in Bitcoin dominance to alt momentum slowly gaining traction across various sectors, including major altcoins and meme-based projects. This gradual build-up, she suggested, could represent an accumulation phase. This is a familiar August pattern that’s mostly always seen before stronger altcoin rallies. Eyes On September For Possible Breakout Although the current readings confirm that it is still Bitcoin Season, Lucie believes everything may already be setting the stage for an altcoin breakout next month. The combination of a drop in BTC dominance and a surge in the Altcoin Season Index above 75 would officially mark the shift. For now, eyes are on this breakout. Particularly, Lucie noted a September window for a decisive move that could ignite a true altseason. At the time of writing, Bitcoin’s market dominance is at 60.0%, according to data from Coinmarketcap. Ethereum, on the other hand, has a market dominance of 12.2%. The last time the market saw altcoin dominance was in December 2024, when the Altcoin Season Index spiked to a reading of 88.  Since then, Bitcoin has maintained control, with the most recent attempt to push the index higher stalling at a 59 reading on July 21. Powered by WPeMatico

Cardano Short-Term Surge Meets Mid-Term Resistance – What’s Next?

Cardano (ADA) is showing renewed strength on lower timeframes, with a short-term surge lifting the price above key moving averages. However, this momentum now faces a critical test as mid-term resistance levels come into play. Will the bulls maintain control, or is a reversal on the horizon? ADA Pushes Above Key EMAs: Bulls Seize Short-Term Momentum Analyst Cexscan on X pointed out that Cardano (ADA) is exhibiting a bullish trend on the 30-minute chart. The asset’s price has surged above the 20, 50, and 100-period Exponential Moving Averages (EMAs), indicating rising buying interest and momentum among short-term traders. Adding further strength to the outlook is the Relative Strength Index (RSI), which currently sits in overbought territory. While this typically signals a possible pause or minor retracement, Cexscan believes that the strong bullish pressure evident in price action could override such a correction in the short run, as long as volume remains healthy. Overall, the combination of bullish EMAs, elevated RSI, and sustained momentum paints an optimistic picture for ADA. Cexscan emphasized that if the current trajectory holds, Cardano could continue its upward path, with intraday opportunities unfolding along the way.  Cardano Caught In A Tight Range: Will The Breakout Come Soon? Thomas Anderson, analyzing Cardano’s 4-hour chart in a recent update, pointed out that the price was moving sideways around the $0.3374 zone. This consolidation is occurring between a defined resistance at $0.7612 and support at $0.6874, both marked with yellow horizontal lines. The market appears to be taking a breather, potentially gearing up for a more decisive move. Adding to the picture is the 200-period Moving Average, highlighted in red, which sits just above the current price and acts as a dynamic resistance level. This moving average has repeatedly blocked bullish attempts, making it a crucial hurdle to watch. A clean break above it could be a major trigger for renewed buying interest. On the broader daily timeframe, Anderson observed that Cardano remains trapped within a larger consolidation pattern. The RSI indicator is hovering around 51, reflecting a neutral stance, while the MACD indicator is also showing little directional bias. This reinforces the view that the market is waiting for a breakout catalyst before choosing its next path. Anderson concluded by focusing on the ascending trendline resistance as a key technical level. A strong push above that line could pave the way for intraday gains, especially for scalpers. However, if ADA gets rejected at that level, it may head back toward the lower end of the range, offering potential shorting opportunities for traders watching closely. Powered by WPeMatico

error:
mr schlusseldienst zurich schweiz 3. Login – lady zara.