6 Weeks Straight: Ethereum ETFs Leave Bitcoin in the Dust

Ethereum exchange-traded funds (ETFs) have outperformed their Bitcoin counterparts for six consecutive weeks, highlighting a shifting preference among investors. Fresh data shows ETH products are drawing steadier inflows even as Bitcoin ETFs continue to command the lion’s share of assets under management. Weekly Data Highlights Ethereum’s Edge According to data from SoSoValue, as of August 27, cumulative inflows into U.S. spot Bitcoin ETFs stood at $54.19 billion, with $144.57 billion in assets under management. By contrast, Ethereum ETFs have drawn $13.64 billion in total inflows and now manage $30.17 billion, representing 5.44% of ETH’s market capitalization. However, while BTC funds remain far larger, Ethereum’s pace of accumulation has become quite notable. Analysis by DefiLlama based on data from Farside Investors shows that spot ETH ETFs have posted stronger inflows than the BTC ones in six straight weeks, including periods of overall market turbulence. You would have to go back to the July 14-20 window, when BTC ETFs were in the middle of a long inflow streak, to find the last time they topped Ethereum. In that week, the Bitcoin-based products saw $2.386 billion in net inflows against Ethereum’s $2.182 billion. Since then, it has all been downhill for the OG cryptocurrency. Between July 21 and 27, Bitcoin ETFs saw just $72.3 million in inflows, while Ethereum ETFs brought in $1.84 billion. The trend deepened from July 28 to August 3, when BTC posted $642.9 million in outflows compared to ETH’s net gains of $154.3 million. Even in weeks where both asset classes recorded losses, ETH still fared better. For example, between August 18 and 24, Bitcoin funds shed $1.179 billion, while only about $241 million worth of capital trickled out of Ethereum ETFs. With still a few days left in the last week of August, ETH is again leading after raking in over $1.2 billion in inflows. Meanwhile, since Monday, their BTC counterparts have collectively managed a more modest $388.6 million. Market Context Looking closer, within the ETF ecosystem, BlackRock dominates both asset classes. Its IBIT product leads Bitcoin with $83.54 billion in net assets after a $50.87 million single-day inflow on August 27. On the Ethereum side, the investment firm’s ETHA fund accounts for $17.19 billion in assets and added $262.63 million that same day, dwarfing activity from competitors such as Fidelity and Grayscale. The story is also similar in the markets, with the two leading crypto assets moving in opposite directions. Bitcoin is trading at $112,967, down slightly by 0.4% on the week compared to ETH’s 7.5% pump in the same period. BTC also lags in the monthly charts, dipping by 5%, while ETH went up by almost 19% in that time. In one year, ETH has advanced by 86%, which is broadly in line with Bitcoin. Furthermore, both assets recently hit new all-time highs, but have since dropped from their respective peaks by almost the same rate. The post 6 Weeks Straight: Ethereum ETFs Leave Bitcoin in the Dust appeared first on CryptoPotato. Powered by WPeMatico

Ethereum Labeled ‘Wall Street Token’ as Banks Adapt to Stablecoin Demands

Jan van Eck, CEO of investment management firm VanEck, recently described Ethereum as “the Wall Street token” while talking about its surge this quarter. In an interview with Fox News Business this week, van Eck said that with the rise of stablecoins, every bank and financial services company now needs infrastructure to process them. Ethereum’s Wall Street Moment van Eck explained that if one person wants to send stablecoins, the recipient’s bank must either handle that transaction directly or rely on another institution to do so. According to van Eck, the real winners in this transition will be the blockchains that provide the foundation for these transactions. He believes Ethereum, or other networks built on its Ethereum Virtual Machine (EVM) methodology, will be central to driving this new financial architecture. “If I want to send you stablecoins, your bank has to figure it out, or you find some other institution to do that. The winner is, who’s going to be building on these blockchains? It’s going to be Ethereum or something that uses Ethereum’s methodology, which is called EVM.” The regulatory landscape for stablecoins has witnessed a tremendous change with the passage of the Guiding and Establishing National Innovation for US Stablecoins Act (GENIUS Act), which was signed into law on July 18th this year. As the first federal legislation of its kind, the act provides a framework to ensure stablecoins are transparent, fully backed, and safely integrated into the US financial system. Post-Genius The market’s reaction to GENIUS was swift. CryptoQuant recently reported that Binance’s stablecoin reserves surged from $32 billion to $36 billion shortly after the law’s approval. Institutions are also accelerating their push into this sector. Stripe, for one, supports stablecoin payouts in over 100 countries and is developing its own Layer 1 blockchain to control payment rails. Circle, fresh off a successful IPO, is expanding beyond issuance with its Circle Payment Network (CPN) and a proprietary Layer 1 where USDC will be the native asset. Even traditional giants are adapting – Visa recently introduced stablecoin settlement APIs to support round-the-clock global payments. Its rival, Mastercard, teamed up with OKX and Nuvei earlier this year to support global stablecoin payments, letting users spend from wallets and merchants accept USDC. The post Ethereum Labeled ‘Wall Street Token’ as Banks Adapt to Stablecoin Demands appeared first on CryptoPotato. Powered by WPeMatico
Beyond the Cloud: Building Resilient Web3 Infrastructure, Interview with Pauline Shangett, Chief Strategy Officer at ChangeNOW

In this interview, we sit down with Pauline Shangett. She is the Chief Strategy Officer at ChangeNOW and strategic advisor at NOWNodes, to discuss her recent talk at WebX titled “Head in the Clouds: Is Hardware the Key to Sustainable Web3 Infrastructure?”. Pauline shares her perspective on the changing landscape of Web3 infrastructure, the myths around cloud vs. hardware, and why true resilience is more about people, processes, and strategy than technology alone. In the following, the CSO at ChangeNOW shares her insights on some of the most pressing matters for Web3 and beyond. Pauline, in your WebX keynote you started with a striking line: “What’s the scariest thing for a CTO? The hack? No, it’s when everything fails without warning.” Can you explain what you meant by that? Absolutely. When we talk about “scary scenarios” in Web3, most people’s minds go straight to hacks, exploits, or malicious actors. And yes, those are terrifying. But in reality, the situations that shake teams to their core are often much simpler and more mundane: one fire, one missed update, one overloaded endpoint, and suddenly your entire product is offline. This isn’t a theoretical concern. We’ve seen major platforms brought down not because of sophisticated cyberattacks, but because of a power outage, a faulty cable, or a misconfigured failover system. And when that happens, you’re not just losing uptime. You’re losing user trust, transaction volume, and in some cases, your reputation. That’s why I framed my keynote as a “reality check.” I’m not a CTO, I don’t write code every day, but I talk to teams, founders, infrastructure leads, and chain developers constantly. And what I’ve learned is this: in Web3, your biggest vulnerability is often the one you never expected, the one outside your attack surface but inside your operational risk model. Infrastructure isn’t interesting until it fails. And then it’s the only thing that matters. Let’s talk about cloud. Everyone knows the benefits like scalability, speed, ease of use. But in your talk, you argued that people overlook the security angle. What did you mean? The narrative around the cloud has always been, “It’s easy, it’s fast, and it scales.” And that’s true. But when people move away from cloud, the most common justification is security. They’ll say, “I don’t want my nodes or my infrastructure controlled by a centralized provider that could censor me, cut me off, or expose me to surveillance.” There’s truth in that concern. Centralization at the infrastructure layer introduces risks. But ironically, what I see is that when people ditch the cloud for “safety,” they underestimate another type of risk entirely: physical risk. Think about it: the cloud’s biggest strength isn’t just elasticity, it’s redundancy. If an AWS region goes down, there are multiple layers of fallback. When you self-host your hardware in a single facility, you don’t have that safety net. And that’s where people can get blindsided. You gave the example of the KakaoTalk data center fire in South Korea, which paralyzed entire services, including Upbit. Why is that case so important for the Web3 industry? Because it demonstrates something fundamental: failure doesn’t have to be malicious to be catastrophic. When a fire broke out in just one data center in 2022, services across the country froze. It wasn’t a hack. It wasn’t ransomware. It was smoke. Yet the consequences were massive, users couldn’t log in, transactions were blocked, and the government had to step in. That’s a national-level disruption caused by a single point of failure. In crypto, we often talk about “crypto winters” in terms of market downturns. But I think the more pressing crypto winter is operational: wars, floods, fires, cut cables, rolling blackouts. Those aren’t “edge cases.” They’re part of the world we live in. And if you’re not planning for them, you’re essentially gambling with your infrastructure. So how does NOWNodes approach resilience differently? What does “planning for failure” look like in practice? At NOWNodes, our philosophy is very simple: don’t ask if something will go wrong – ask when. Because it will. That’s the only certainty in infrastructure. Our systems are deliberately distributed across multiple regions: the EU, the US, and Asia, with physical presence in countries like Germany, Finland, the Netherlands, the United States, and Singapore. That’s not just a checkbox for compliance. It’s a strategy of survivability: placing nodes where they can withstand political, geographical, and technical risks. We also operate on a 2N+1 architecture. That means for every critical component like power, compute, network, we don’t just have one backup. We have two, plus a spare. So if one system fails, traffic shifts instantly. If the backup also fails, the spare takes over. It’s a layered safety net. And we don’t just trust the system blindly. We run regular failover simulations. We intentionally shut down systems in mirrored environments to see what breaks. We do stress tests, region tests, even attack simulations. Because you don’t want the first time you test resilience to be the moment a real crisis happens. For years, cloud was considered the cheaper option. But you’ve suggested that equation is changing. Can you walk us through that? Five years ago, cloud was the obvious choice. You avoided massive upfront CAPEX, you only paid for what you used, and scaling felt effortless. But that narrative has shifted dramatically. Today, the “Big Three” cloud providers, like AWS, Google Cloud, Azure, dominate the market. And as happens in any near-monopoly, pricing trends upward. AWS compute costs, for example, rose by more than 20% in just a single year. Almost 40% of companies reported cloud bills spiking by over 25% in the last 12 months. Meanwhile, hardware has become more predictable. Yes, you pay more on day one – servers, racks, power. But when you spread that investment over 7 – 10 years, the economics flip. One engineer famously calculated that an $1,100 server costs about $110 per month over a decade. Compare that with $2,000 – $7,000 per month for equivalent resources in the

BTC, ETH, XRP, BNB Warnings: Profit Status Could Trigger Price Declines Soon

TL;DR Doctor Profit warns that 90–100% of crypto investors in profit could trigger mass profit-taking and subsequent price drops. XRP weakens while BNB fully peaks, but Solana shows strong growth with rising network activity. $261M liquidations hit both longs and shorts, raising doubts despite near-universal profitability. Investors Deep in Profit A sharp rise in profitability among major cryptocurrencies has prompted analysts to warn of potential profit-taking. Doctor Profit wrote, “90% of all BTC investors are in profit, 98% of all ETH investors are in profit, 92% of all XRP investors are in profit, and 100% of all BNB investors are in profit. There is too much profit in the markets!” Bitcoin trades at $113,000, with nearly 90% of supply in profit. Daily active addresses stand at about 711,000, though on-chain volume fell almost 9%. Futures open interest is $61.2 billion, supported by a small positive funding rate. Ethereum shows an even stronger picture. At $4,600, about 98% of the supply is in profit. Activity has cooled, with daily active addresses down 3% and on-chain volume off nearly 25%. Futures open interest is $44 billion, with longs still leading. Source: Glassnode XRP Slips, BNB Peaks, Solana Soars XRP trades at $3, with 92% of supply in profit. Daily addresses fell to 38,000, but on-chain volume rose 23% to $2 billion, suggesting some investors are starting to take gains. BNB, at $870, has 100% of its supply in profit, a rare situation. Activity surged 19% to 2 million daily addresses, and volume grew to $2.7 billion. Funding rates, however, slipped into negative territory at -0.0034%, pointing to hedging against downside risk. Solana is trading at $213, with 96% of supply in profit. Network use is strong, with 4 million daily addresses, up 7%. On-chain volume jumped 29% to $10.1 billion. Futures open interest is at $8.6 billion, with positive funding. Unlike Bitcoin and Ethereum, Solana’s profitability is paired with rising usage. In addition, Cronos (CRO) has surged 59% in 24 hours to $0.37, making it one of the best performers in the market. On-chain data shows 87% of CRO holders are in profit, placing it alongside other major coins flashing high profitability. Trading volume has jumped to multi-month highs. The move follows weeks of steady recovery and was accelerated by news of a Trump Media partnership with Crypto.com. Sentiment around CRO shows both optimism and anxiety, with analysts cautioning that such profit levels often precede selling pressure. Liquidations Sweep the Market Even with most investors in profit, liquidations remain heavy. In the past day, over 93,900 traders were liquidated, totaling $261 million. Longs accounted for $134.52 million, while shorts lost $126.35 million. Source: Coinglass Ethereum led with $746,000 liquidated, followed by BERA at $298,000. Bitcoin saw $124,000 in liquidations. Mid-cap and smaller tokens like NMR, XPL, and RLC ranged from $50,000 to $150,000. DeFi Planet questioned the disconnect: “If almost everyone is in profit, then who is getting liquidated when we hear headlines like $550M wiped out from the market?” The post BTC, ETH, XRP, BNB Warnings: Profit Status Could Trigger Price Declines Soon appeared first on CryptoPotato. Powered by WPeMatico
Forget a Big September Catalyst: Ethereum’s Real Strength Lies Elsewhere, Says Curve Finance

Ethereum (ETH) has managed to tap $4,600 level after this week’s market downturn. The latest recovery remains modest, as the leading altcoin gained a little more than 7% over the past week. Experts now argue, though, that September won’t bring flashy catalysts either. Don’t Expect Fireworks in September In a statement to CryptoPotato, Curve Finance said September is unlikely to bring a single “headline” catalyst. Instead, the team added that Ethereum’s importance lies in its role as the underlying infrastructure powering decentralized finance (DeFi). By calling it the “operating system of DeFi,” they added that even though the market has seen a pullback after ETH’s all-time high, the network’s long-term fundamentals remain strong, with institutional adoption steadily growing. “These may not make daily headlines, but they are precisely what cements Ethereum as the backbone of both DeFi and the emerging digital economy. Development at the base layer is accelerating. Efforts by the Ethereum Foundation, Vitalik Buterin, and the zk/ethproofs groups are steadily pushing L1 scalability forward.” The comments align with the Ethereum Foundation’s recent move when it outlined its ambitious “Trillion Dollar Security” with the phase focusing on strengthening user experience (UX) security, combining immediate fixes with longer-term initiatives that aim to protect Ethereum as it scales. The Foundation stated that wallet security sits at the heart of this effort, as safe key management and transaction signing are essential for user trust. By setting a baseline security standard for wallets and addressing blind signing risks, the EF seeks to ensure Ethereum can support billions of users and trillions in on-chain capital. This structural focus is reflected in on-chain trends as well. Ethereum’s Contract Boom CryptoQuant’s analysis revealed that Ethereum’s recent surge in new smart contract creation is a strong indicator of renewed network utility and adoption. Looking back, Smart contract growth has long mirrored Ethereum’s market cycles. The 2020-2021 DeFi and NFT boom, for example, coincided with a massive ETH rally. But similar bursts of contract activity have also preceded corrections, most notably in 2018 and late 2021. The current renewed surge in contract deployment demonstrated confidence in Ethereum’s long-term utility. As such, growth in this metric could provide the structural base for ETH to climb beyond the much-anticipated $5,000 threshold. The post Forget a Big September Catalyst: Ethereum’s Real Strength Lies Elsewhere, Says Curve Finance appeared first on CryptoPotato. Powered by WPeMatico

Dogecoin Setup Signals Massive Breakout: DOGE Season Not Started Yet

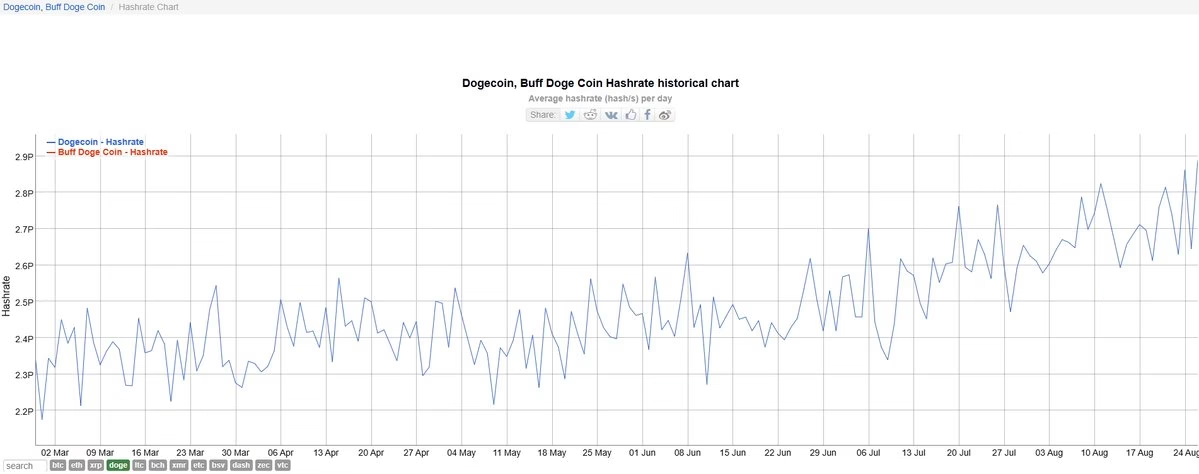
TL;DR Dogecoin consolidates in a bull flag pattern, with a breakout target at $0.24 resistance level. Its hashrate surged above 2.9 PH/s, marking the strongest network security in its history. Thumzup Media to acquire Dogehash, expanding Dogecoin’s mining base with 2,500 ASIC rigs. Long-Term Cycles Point to Familiar Setup Dogecoin (DOGE) was priced at $0.22 at press time, showing a 1% daily gain and a 2% increase over the week. Trading volume in the past 24 hours stood at $2.27 billion. Past cycles highlight the token’s explosive history. In 2017, DOGE rallied about 9,000%. During the 2020–2021 cycle, gains exceeded 26,000%. Both rallies came after long consolidation phases, where the price moved sideways for extended periods before breaking higher. Since 2021, DOGE has traded mostly between $0.05 and $0.30, forming a multi-year base. Indicators on the weekly chart show a pattern similar to those seen ahead of previous surges. Trader Tardigrade said: “Dogecoin season has not started yet,” pointing to the view that the asset is still in an early phase. $Doge/weekly#Dogecoin season has not started yet pic.twitter.com/usbvOokXgj — Trader Tardigrade (@TATrader_Alan) August 28, 2025 On the 4-hour chart, DOGE has developed a bull flag, with consolidation between $0.218 and $0.222 following a sharp upward move. This type of structure often precedes continuation when the price breaks out of the range. Trader Tardigrade noted: “#Dogecoin Bull Flag LOADING A breakout could target $0.24, hitting the previous resistance level.” The $0.24 zone remains the immediate resistance to watch. Hashrate Climbs to Record High Dogecoin’s network strength has reached a new peak. The hashrate, which measures the total computing power securing the blockchain, rose from an average of 2.2–2.4 PH/s in March to more than 2.9 PH/s in late August. Analyst KrissPax reported: “Dogecoin Hashrate has just hit an all time high! $DOGE.” Source: X The official Dogecoin account responded: “Could this be due to certain parts of the community mobilizing to protect against some possible threats? Like something that happened to Monero recently? Hmm…” Earlier this month, the Qubic blockchain community voted to redirect hashpower toward DOGE for a potential 51% attack. That incident drew attention to the importance of mining power in maintaining network security. Corporate Moves in Mining Sector Thumzup Media Corporation, a Nasdaq-listed company, confirmed it will acquire Dogehash, a mining operation based in North America that focuses on Scrypt assets such as Dogecoin and Litecoin. Dogehash operates around 2,500 ASIC miners and is expected to scale capacity before year-end. Once completed, the merger would make the combined entity one of the largest Dogecoin mining operations, adding to the network’s industrial base. The post Dogecoin Setup Signals Massive Breakout: DOGE Season Not Started Yet appeared first on CryptoPotato. Powered by WPeMatico

Could XRP Hit $200? New Regression Model Sparks Speculation

There is a new mathematical model proposing a future where the price of Ripple’s native XRP token shoots to $200. However, this optimistic forecast clashes with the asset’s present struggle to hold the $3 level, creating a stark divide between theoretical possibility and on-chain reality. A Regression Model Meets Market Reality The model, fronted by analyst EGRAG CRYPTO, used a linear regression model on a logarithmic scale, applying a two-standard deviation channel to XRP’s monthly price chart. EGRAG measured its reliability using its R-squared value of 0.84754, indicating a very strong historical correlation between the variables studied. According to the market watcher, XRP has already touched the upper edge of this model three times before, missing once in 2021 but significantly shooting past the forecasted range on another occasion. He suggested three possible outcomes for the cryptocurrency. The first, resulting from a simple hit of the upper band, would put the token at about $27. And were the asset to repeat a 45% miss witnessed in its 2021 cycle, then EGRAG expects it to move to around $18. However, his most dramatic scenario that would push XRP to $200 involves a 570% overshoot mirroring an event from late 2018. While this mathematical optimism may be exciting, the cryptocurrency’s immediate price action tells a different story. In CryptoPotato’s latest assessment of the market, analyst CryptoVizArt reported that the Ripple token was trading inside a symmetrical triangle, with $3.3 acting as the key barrier and $2.8 the immediate floor. This hesitant price movement is also happening alongside a huge drop in network activity. Recent data from Glassnode showed active addresses had plummeted to just 38,303 as of August 27, down dramatically from spikes above 500,000 seen in June. Price Movements and Outlook At the time of this writing, XRP was changing hands at around $3.00 per CoinGecko, showing marginal 24-hour gains of 0.2%. In that time, it held within a narrow range between $2.96 and $3.04, reflecting subdued volatility. On the weekly scale, it oscillated between $2.81 and $3.11, consistently failing to break free from the $3.1 to $3.3 resistance band. However, it did better in that period, adding 3.6% to its value, even though it remains down 7.3% over the previous fortnight. Meanwhile, XRP’s 30-day performance is still positive at 4.9%, while over the last year, it has soared more than 420%, thanks in part to its July 18 all-time high of $3.65. For the $200 forecast to become a reality, it would not only require a historical anomaly but also a fundamental shift in network adoption and market structure that current data does not reflect. For now, the model provides a tantalizing narrative, but the market will demand proof. The post Could XRP Hit $200? New Regression Model Sparks Speculation appeared first on CryptoPotato. Powered by WPeMatico

Ethereum Price Analysis: ETH’s $5K Goal Still in Play if This Crucial Support Survives

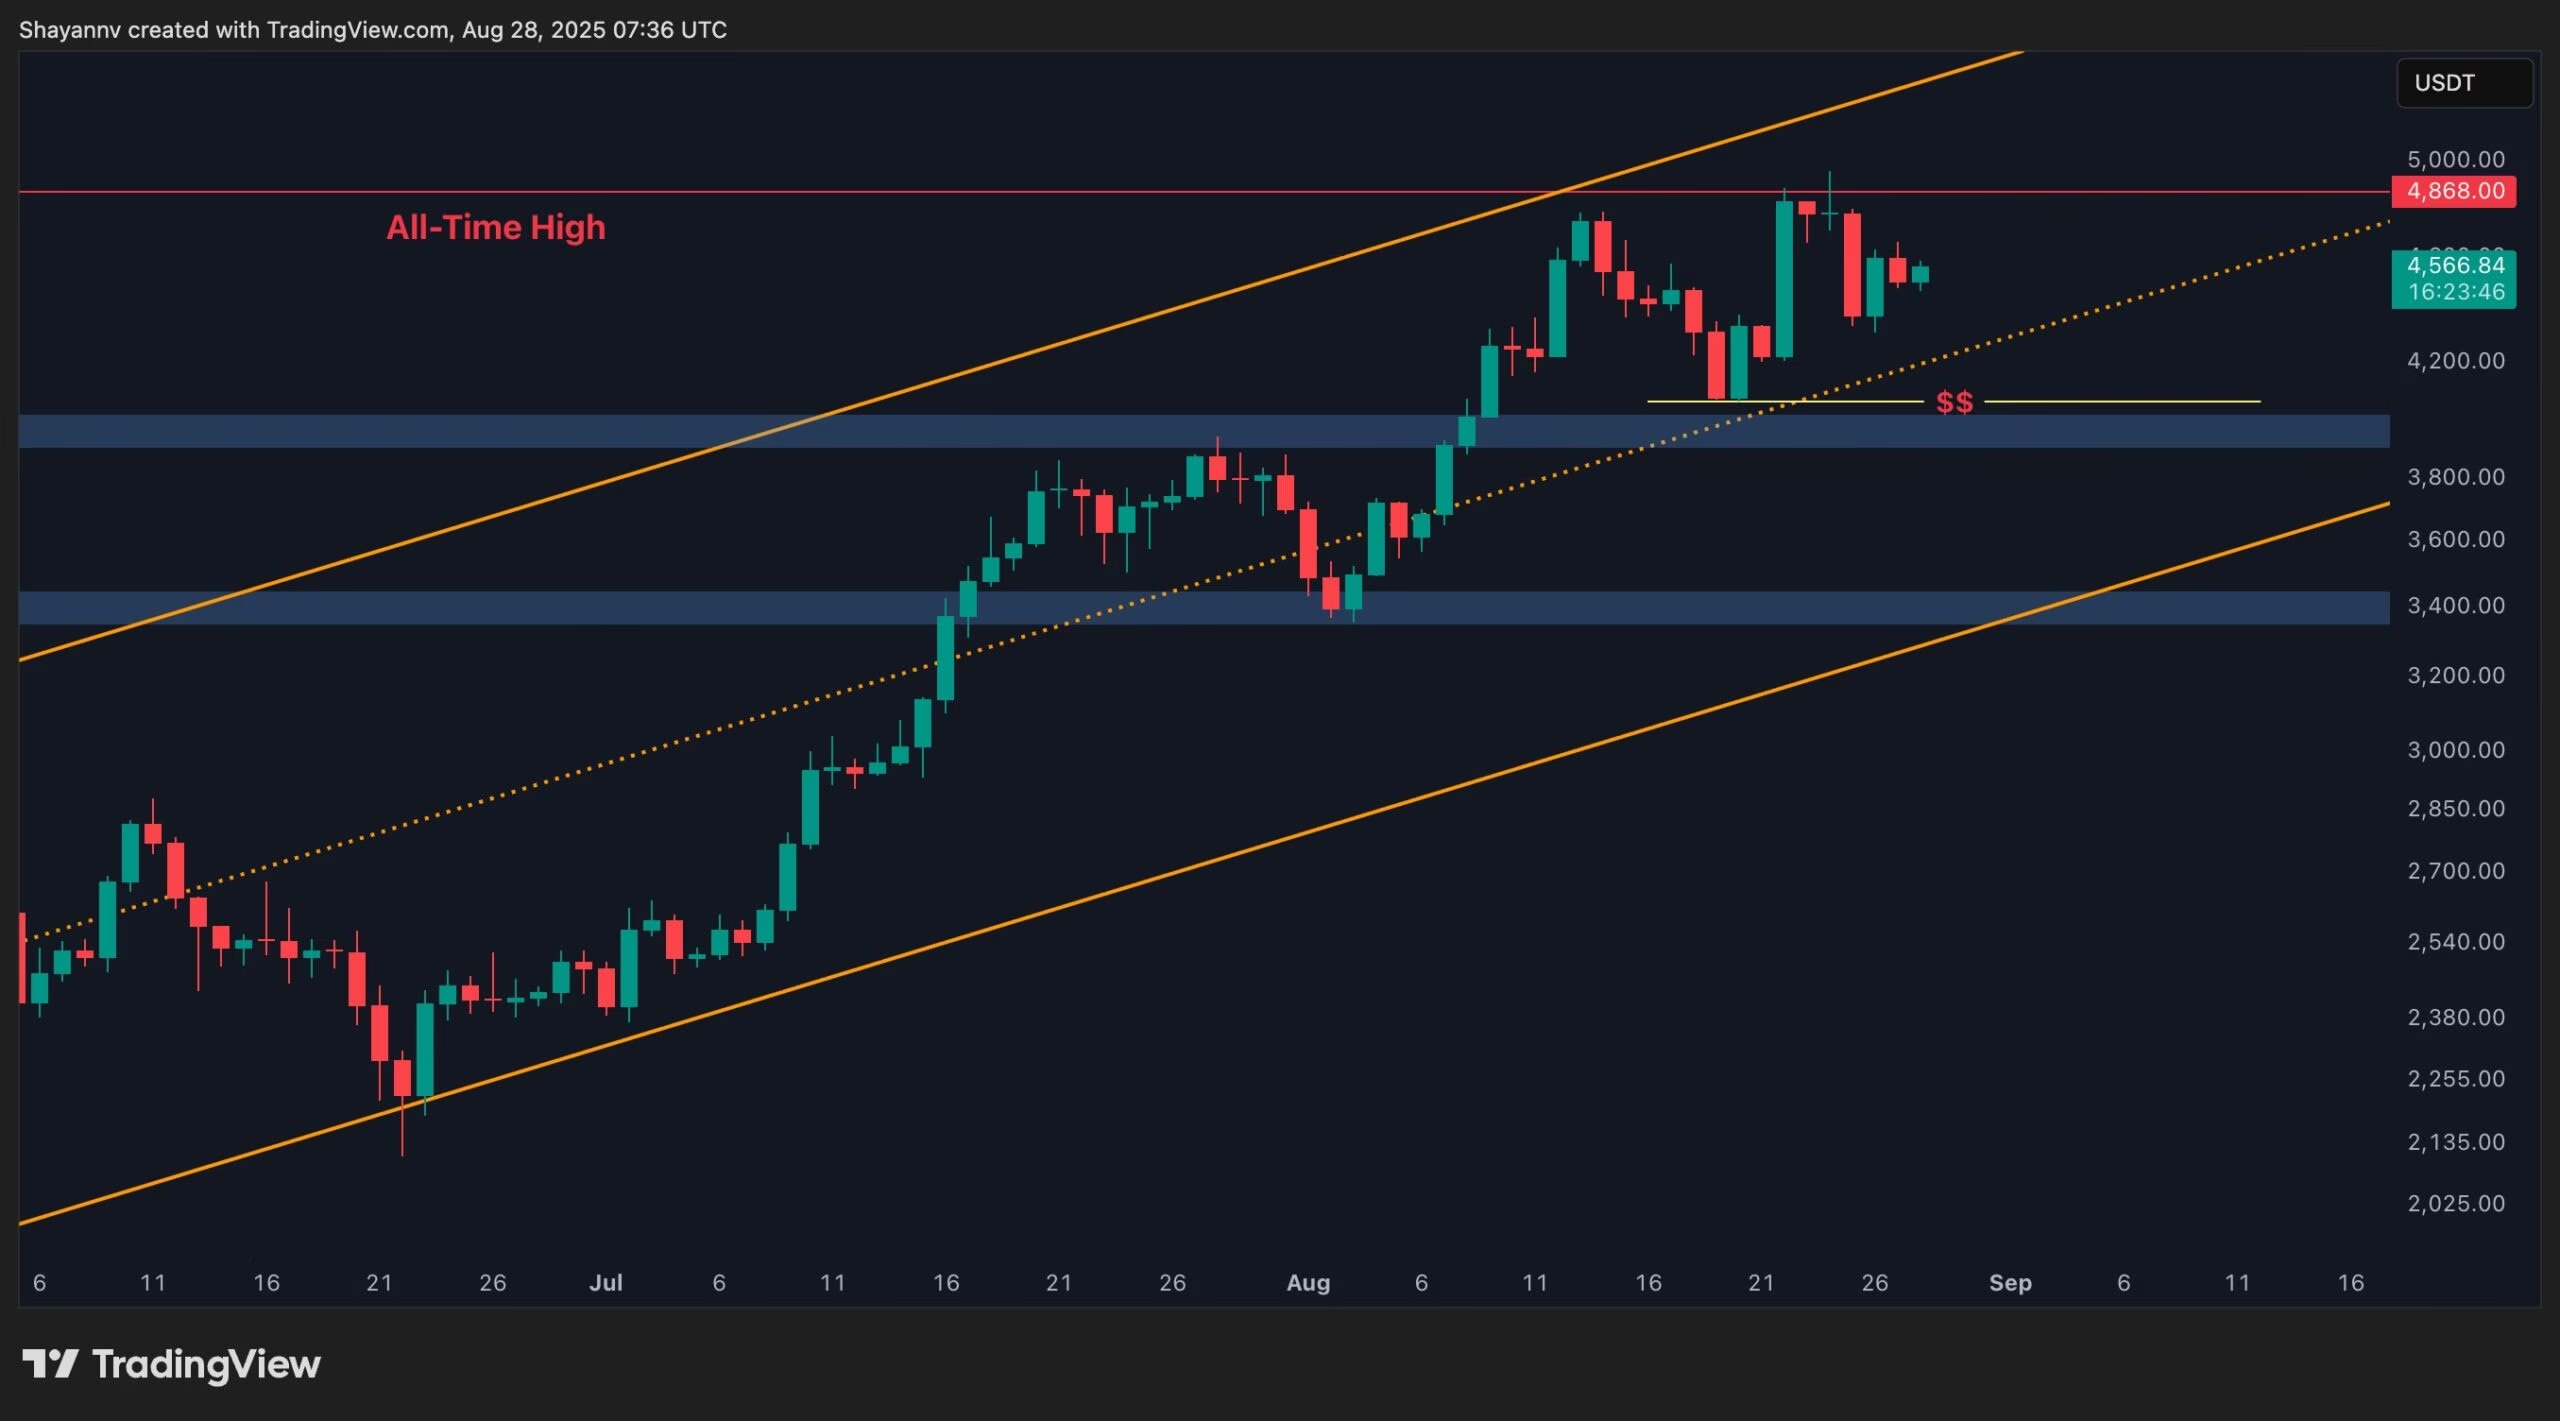
Ethereum continues to consolidate below its all-time high of $4.9K, with the price action respecting the ascending channel structure on higher timeframes. The market is hovering around a critical support confluence, where bulls and bears are competing for short-term control. Technical Analysis By Shayan The Daily Chart On the daily chart, ETH buyers are struggling to reclaim the $4.9K resistance zone, which has rejected the price on multiple attempts. The asset is now compressed within a tight range between the $4.9K ATH and the ascending channel’s midline support around $4.3K, shaping a triangle formation. If the price breaks lower, Ethereum faces a crucial retest of the $4K level, a psychological pivot and liquidity-heavy zone where buyers previously defended aggressively. A sustained hold at $4K could set the stage for another attempt at the ATH, while a decisive breakdown would expose the deeper $3.6K–$3.8K demand region. The 4-Hour Chart On the 4-hour timeframe, ETH is consolidating between $4.4K support and $4.9K resistance, forming a tight range after its recent rejection at the ATH. The ascending trendline from mid-August continues to provide near-term support, keeping the short-term structure tilted bullish. If Ethereum holds this trendline and breaks above the $4.7K minor high, momentum could quickly carry it back into the ATH region around $4.9K–$5K. Conversely, losing the trendline would likely trigger a liquidity sweep toward $4.2K, aligning with the daily support zone. Until a decisive breakout occurs, ETH is expected to remain inside this wedge-like structure, with volatility building at its boundaries. Onchain Analysis By Shayan Most recently, exchanges recorded a cumulative 628K ETH in outflows, with consecutive daily netflows each near or above -100K ETH. This represents one of the largest and most consistent withdrawal patterns in recent months, signalling a meaningful reduction in exchange liquidity. At the same time, large whale wallets holding between 10K and 100K ETH have steadily expanded their balances to new highs. Mid-sized wallets in the 1K–10K ETH range have remained largely flat, while smaller cohorts have continued to decline. The clear alignment between persistent outflows and growing whale accumulation suggests that institutional-scale demand is actively absorbing circulating supply. This shift carries important implications for market dynamics. With less ETH available on exchanges, the market becomes less liquid on the sell side, making it harder for significant amounts to be sold without pushing prices lower. Meanwhile, as demand continues to increase while supply tightens, the setup favours upward momentum. This structural imbalance can act as a powerful catalyst, positioning Ethereum for further price appreciation once the current consolidation phase resolves. The post Ethereum Price Analysis: ETH’s $5K Goal Still in Play if This Crucial Support Survives appeared first on CryptoPotato. Powered by WPeMatico

Ripple (XRP) News Today August 28th

Ripple, its native token XRP, and its stablecoin RLUSD remain some of the most intriguing topics in the crypto space. In the following lines, we will touch upon the latest news surrounding them. Ripple’s Recent Endeavors Earlier this week, the leading Chinese supply chain finance provider, Linklogis, announced a strategic deal with Ripple to deploy its application on the XRP Ledger (XRPL) mainnet and drive its large-scale commercialization.  “This partnership not only marks its entry into the global decentralized financial ecosystem, but also demonstrates the company’s continued innovation in cross-border trade finance,” the announcement reads.  In a later stage, the two parties will explore deeper collaboration in areas like stablecoins and supply chain finance innovation.  In addition to Ripple’s progress in Asia, there have been rumors that XRP might receive additional backing from the US-based exchange Uphold. The trading venue released a cryptic post on X consisting of the numbers “01011000 01010010 01010000.” Тhe Ripple community was quick to decipher the code, pointing out that the sequence above is the binary representation of XRP using the ASCII standard. Uphold listed the asset in 2018 and didn’t halt trading after the lawsuit with the US SEC began in late 2020 (like some other exchanges did). That said, it remains a mystery what its next potential XRP move will be. RLUSD in the Spotlight Again Ripple officially introduced its stablecoin in December last year. The product, dubbed RLUSD, is pegged 1:1 to the US dollar and aims to facilitate the instant settlement of cross-border payments, thereby strengthening the entire ecosystem. Over the last several months, the stablecoin received backing from renowned financial giants like the oldest bank in the United States, BNY Mellon. Earlier this week, the DeFi protocol Aave launched Horizon – a platform “allowing tokenized products to be used as collateral and flow more efficiently across markets.” Among the assets supported by the newly introduced entity is RLUSD.  XRP Price Outlook Last week, the asset underwent a significant correction, with its price tumbling below $2.80. In the following days, the bulls managed to reclaim some lost ground, and XRP currently trades at around $3 (per CoinGecko’s data). Numerous analysts believe the token has the potential to chart much more impressive gains during this cycle. X user Mags argued that the price has recently consolidated the same way it did in 2017. Back then, this was followed by a massive resurgence, with the analyst setting $5.20 and $7.30 as the next targets.  STEPH IS CRYPTO, on the other hand, recently warned investors to stay cautious since the peak of the bull run may arrive in the next one or two months.  The post Ripple (XRP) News Today August 28th appeared first on CryptoPotato. Powered by WPeMatico

Solana (SOL) Just Did Something It Hasn’t Done Since February

Solana’s (SOL) recent price action has demonstrated a classic technical breakout pattern. The popular cryptocurrency climbed above the $213 threshold after rising by over 6% in the past 24 hours and is testing resistance levels that have held since February of this year. This breakthrough potentially points to the end of a months-long consolidation phase. SOL Breakout According to Santiment’s latest findings, the accompanying retail sentiment data reveals an extraordinary bullish tilt. In fact, a positive commentary was found to be dominating negative opinions at a 5.8:1 ratio. This is the strongest bullish sentiment reading in nearly three months. While such technical breakouts often lead to steady upward momentum, the extreme nature of retail optimism in SOL, however, needs careful monitoring, as euphoric sentiment levels can sometimes precede market corrections. Experts from B2BINPAY had recently stated that SOL’s jump back above $200 was “more than just a speculative pop,” which aligned with strong on-chain metrics. Blockchain throughput also witnessed significant growth since last month, alongside increased DeFi total value locked as well as expanding NFT activity and GameFi adoption. Solana War-Chests Momentum is not just limited to charts and on-chain metrics. For instance, Sharps Technology announced a $400 million treasury strategy centered on Solana’s native token. The medical device maker signed a letter of intent with the Solana Foundation to acquire $50 million worth of SOL tokens through a private investment in public equity (PIPE) deal. The purchase will be made at a 15% discount to SOL’s 30-day average price. Additionally, Galaxy Digital, Multicoin Capital, and Jump Crypto are raising $1 billion to create a dedicated SOL treasury. Pantera Capital is also betting big on Solana. Reports claim that the crypto hedge fund is aiming to raise $1.25 billion by converting a Nasdaq-listed firm into “Solana Co.” The plan includes $500 million upfront and $750 million via warrants, which could potentially create the world’s largest SOL treasury, for now. The post Solana (SOL) Just Did Something It Hasn’t Done Since February appeared first on CryptoPotato. Powered by WPeMatico

error: